


Traders World Articles

Related to The Universal Golden Keys Series
By Alexander Straker
Article 1 – Trader’s World Spring 2020
Using Pendulum Motion to Define Trend and Swing Limit
"The power to determine the trend of the market is due to my knowledge of the characteristics of each individual stock and a certain grouping of different stocks under their proper rates of vibration. Stocks are like electrons, atoms and molecules, which hold persistently to their own individuality in response to the fundamental law of vibration. Science teaches that 'an original impulse of any kind finally resolves itself into a periodic or rhythmical motion; also, just as the pendulum returns again in its swing, just as the moon returns in its orbit, just as the advancing year over brings the rose of spring, so do the properties of the elements periodically recur as the weight of the atoms rises."
– W. D. Gann
In his metaphoric, yet educational explanations Gann constantly hinted at deeper truths. What did Gann really mean by this intriguing quote? A number of important hints are given here regarding market methods and the pathways of study in science that underpin such methods with sound, and enlightening logic. The important hint we will focus on in this article is pendulum motion.
This CHFJPY chart example uses a single technique based on revealing the symmetry of pendulum motion. No less than 7 times in a row, ONE single angle technique (that is one line only!) produced a near touch perfect reversal pivot each and every time price touched the ‘angle of pendulum reaction’. (see chart next page: red circles). The fact that this same natural symmetry of pendulum motion continued to occur repeatedly defined this trend segment as a stable trend. Confidence in trend helps trader psychology.
CHFJPY

Every single one of the 7 consecutive impulse vectors this technique was applied to in the trend segment produced a clear, ideal low risk trade opportunity with plenty of reward for risk. In 1 of the 7 cases, price took another swing back at the angle of pendulum reaction (APR) line and this second reaction swing exceeded the normal limit of motion (see green angle set) then reverses precisely at the next harmonic angle of ‘overbalance’ (green dashed angle). This overbalance line is the second angle of importance in the core pendulum motion angle set and it rejects price, sending it back down into a stable trend again as defined by the next set of angles (purple) which show a normal pendulum limit reaction again.
The first principle of pendulum motion is: if the correction to an impulse vector ends within the limits of pendulum motion, the trend is stable in the vector direction. Plus ‘end of trend’ as defined by pendulum motion, is hinted at the first time the new reaction vector EXCEEDS our angle of ‘overbalance’ for any given angle set, this is when the existing trend is no longer considered stable and a hint it may be coming to an end. Pendulum angles not only precisely define outstanding low risk potential entry points (limit of motion), they also define the validity of the trend according to the symmetry of pendulum motion.
The core angle of pendulum reaction (APR) is calculated via a strictly defined mathematical technique, and natural symmetry is achieved via application of Pythagorean vector scaling principles. The CHFJPY chart example shown next was re-scaled for each set of angles. This re-scaling is not always necessary, many techniques do not require this. The point here was to show the incredible consistency of pendulum motion in precisely defining both the trend and precise limits of several consecutive swings when correctly applied.
CHFJPY
The core harmonic tools of this system (require scaling taught in the book) provide the trader with the capacity to project the natural symmetry of pendulum motion as pure circular angle values. This method uses ‘seed information’ directly from the original vector being measured, and a strictly mathematical calculation is used to firstly set a circle-based scale, then apply relevant angles of reaction to the original vector according to pendulum motion.
If you have been beating the Gann path a while, you already know the value of a true universal method, this is based on natural law of pendulum motion, and consistently and accurately uncovers the precise limits of market swings (further harmonic geometry is used in the full system).
As in the CHFJPY example above the core method begins with choosing a price action vector representing ‘action’ and plots a single main angle of ‘reaction’ to this vector, this is done multiple times in the example, those are the sets of coloured lines. A secondary line of ‘overbalance’ is also part of the main lines in the core tool set, this is the green dotted line in the above example as only one of these is plotted above as price action only ventured beyond the primary reaction line once in the whole sequence of this example. As price reversed at this reaction line, we begin another vector from there as the new action line, and plot a new reaction line, and so forth.
It is worth noting this core single technique applied above provided a near perfect pivot reversal at the ‘reaction’ line 7 times in a row, successfully locating an ideal low risk entry for each successive market move in the downtrend sequence. Not to say the author advocates relying on a single technique, this is of course incredibly valuable as a foundation to build set ups around. The reaction lines themselves represent natural angle of pendulum motion reaction vector swings according to each ‘action’ vector measured and are a true universal market phenomenon. Straker goes very deep into theory of why this works in his book, so much so readers are left with a rich sense of confidence in the basis for expecting precision and consistency, psychologically this makes a world of difference!
Pendulum Motion is a very natural and elegant harmonic solution to identify and capture the majority of ‘end of retracement’ reversal pivots during a stable trend segment. The core tool alone is an extremely powerful compliment to any system of swing trading or even long-term investing. Best of all it is an almost completely unknown form of genuine harmonic analysis, giving you a true ability to see what others cannot.
In a stable trend, the single main ‘reaction’ angle (APR) will continually give an accurate support & resistance level for the retracement to the original vector. If the swing reaction to the original vector chosen produces a deeper retracement than the single main APR line, then the secondary ‘overbalance’ line (ACS) will be the next major support/resistance (limit of pendulum motion) if the trend is to remain intact. In both cases we expect a precise reaction at the angle and one important aspect of the method is to look for a high degree of precision when price reacts to the pendulum angles, as that is what our expectation should be when correctly applying natural law harmonics of pendulum motion during a stable trend segment made up of impulse-correction/action-reaction sequences!
Those who have come to appreciate the recent work of Sean Erikson will immediately appreciate the significance of what is being presented here. To be clear this is absolutely not the same thing as Erikson’s brilliant work, and not an astro dependent chart application so you don’t have to have astro software to use the pendulum motion methods.
The principle at work behind this tool has many applications far beyond the core tool itself, the advanced geometry introduced my recently released Book 1 of The Universal Golden Keys Series: Pendulum Motion, Geometry of the Circle presents an expose of an incredible array of powerful geometric information available from a simple ‘seed’ vector (the initial impulse or Gnomic Event – GE). Any ‘seed vector’ can be viewed as a DNA pattern for growth, and after thoroughly explaining the core tool mathematics, the concept is extended with arcs and boxes introduced to project limits of natural growth phases as targets.
An original mathematical pattern discovery I have made is also explained in the book, and this elegantly defines the most common Elliott wave impulse-retracement fractal sequence known as a 5-wave impulse and 3 (or 5) wave retracement. Information from this pattern discovery becomes the basis for a full geometric ‘growth template’ that can be applied to any ‘seed vector’ and is founded on the core pendulum motion principle.
The beauty of the core pendulum angles tool in this method, is that specific vector information absolutely defines the scaling rule mathematically, and once the scale is set the normal limit of pendulum motion is accurately given by a single main ‘angle of pendulum reaction’ (APR), plus an ‘angle of critical support’ (ACS) is used to catch any overbalance.
These two angles will define the normal limits of pendulum motion of a retracement (correction) to any genuine impulse vector, with approximately 80% accuracy in any market and on any time frame.
These pure geometry techniques unveil a truly universal law of market symmetry! Precise and definitive, the natural and perfect symmetry of pendulum motion is seen at work again and again identifying precisely defined reversal pivots! (see chart examples). This level of precision is what we should expect when using authentic harmonic methods to locate genuine points of strong harmonic resonance in price and time!
Please note that the authentic key chart scales used for the core technique demonstrated here have been deliberately altered in the charts to preserve the method, however the angles are in the precisely the same position as they would be on the original scale so all lines are true to the original picture.
GOLD Daily chart with a bullish vector and a couple of related pendulum angles.
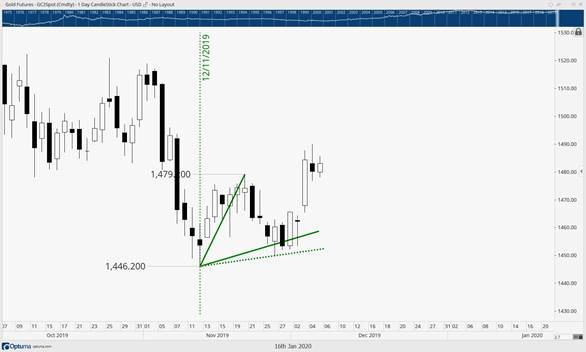
Note the first couple of reactions to these lines (both APR and ACS) are near perfect, and these angles can be drawn in place as soon as the vector is completed, and a retracement is underway. This technique works universally for any time-frame or market. The long term target projected by the ‘seed vector’ is successfully met in this case (see below).

Crude Oil Index

A simple example of a bullish vector and the most significantly related angle to the vector itself, the APR. Only one trading line, that’s the solid line below (Remember the scale has been deliberately changed to preserve the technique, lines remain in same position relative to price).
Another near touch perfect reaction to the main ‘angle of pendulum reaction’ line! This tool demonstrates again and again an uncanny ability for locating precise reversals and is a foundation technique for identifying low risk opportuities! In a stable trend (continual and steady Elliott 5 wave genuine impulse for example) this single line technique is ideal for identifying high probability, repeatedly accurate reversals to each retracement wave segment of the impulse set (not that it is wise to rely on a single technique of course).
FTSE Weekly with main angle related to original vector

As with all methods, not every example is perfect! This FTSE Weekly chart overshot the main angle a little, but never closed below it. Note the two candles either side that rested on the angle. As mentioned this main angle technique will work as support repeatedly during a trend. In fact, this is a technique that actually tells you if the trend remains stable!
Of course the system is not being shown in full here only the core angles. There is also a confirmation system taught that clarifies the precise harmonic points of resonance in price and time. The confirmation tools and principles here are exceptionally powerful in pinpointing low risk set ups. The full pentagonal growth template taught has many comfirmation tools built geometrically into the lines and arcs of the template. Pendulum Motion, Harmony of the Circle is published by Institute of Cosmological Economics.
Alexander Straker
January 2020
Trader’s World Article 2 – Summer 2020
Using ‘Reverse’ Pendulum Motion to Define Vector Slope
This second article in the pendulum motion series introduces a new and original concept that extends the use of pendulum motion symmetry in a brand-new direction never seen before to my knowledge.
Pendulum Motion, Harmony of the Circle (book 1 of a series) presents new breakthroughs in understanding and applying the symmetry of pendulum motion, with multiple tools, applications, and the universal scaling key developed from over 30 years of professional trading and fund management experience.
To give an idea of how simple, elegant and consistently accurate this core concept is, coming up is a chart with multiple examples marked up, there are so many it becomes a little messy and in fact, some other equally accurate possibiities had to be left off!
In every case without fail, we can observe price action reversals from the‘limit of pendulum motion’ angles are extremely accurate, and in most cases a large trend continuation leg follows afterwards. The angle technique applied to unveil pendulum motion is almost always is a two line set of which a single line is by far the most important as the primary angle: the natural angle of pendulum reaction (APR).
Did I mention yet this system is simple and well defined to the point of being idiot proof? That’s why I personally like it!
There are many new concepts presented in this book, and of these ‘Reverse’ pendulum motion is one of the more simple and powerful ones (shown in the coming example). This technique uses a theoretical base line to project an exact reactionary vector slope following successful rejection of a pendulum angle, best of all this results in a single line to plot the future vector’s slope, and like with the core tool there is no discretion, one single line is plotted!
The purple pairs of lines in the next chart example represent this reverse pendulum motion technique. A theoretical base line of thrust is applied first, and to be clear, the base line is not relevant as support or resistance, note in the chart that price never touches the shallower angle purple lines – they are only used to set the technique up. The angle produced as a reaction to the base line acts as a ‘line of thrust’ forecasting the exact slope the reactionary vector will travel along using a single line.
XJO multiple pendulum effects, continual touch perfect major reversals!

This XJO chart has been prepared set to a scale calculated to suit the pendulum motion techniques. However the actual scale was deliberately altered slightly to preserve integrity of the method. All lines remain true. EVERY MAJOR SWING on this chart was defined PRECISELY by the core pendulum motion technique. ‘Reverse’ pendulum motion is also shown above by the purple lines.
After the required scaling step is completed initially, the chart never needs rescaling for all of the following techniques and this is exactly how they appear in the chart above.
Pendulum motion is a real phemonenon in the market, Gann said it, Baumring said it, now in this new book the maths, method, scaling key, logic and further geometric templating are being clearly and thoroughly explained. This example is a little busy with lines but the point is to illustrate the sheer power and consistent symmetrical perfection of the law of pendulum motion! Sometimes you need to remind yourself these were pre-drawn lines before the price-time reactions at the arrows, just look at the crazy number of touch perfect pivot reversals and most of this is from ONE single line technique!!
IMPORTANT NOTE: THIS IS NOT THE ENTIRE SYSTEM, ONLY CORE ANGLES
- Initial Green Impulse Vector. The core technique angles, the two large green pendulum motion based angles are plotted next. These are the primary pendulum angle of balance and secondary angle of overbalance (Angle of Critical Support or ACS line). As you can see for yourself every major swing is unveiled in the sequence of elegant geometry to follow using only primarily a single balancing line technique, the key is to this the scaling method.
- Price drops to the secondary overbalance angle and reverses precsiely on the line. A purple vector parallel to the green overbalance line is added to the low of the retracement vector and this is then used for a ‘reverse pendulum’ set up back the other way, the steeper purple line that catches the next top to perfection! This time the vector acts differently due to this being a ‘reverse vector’ application. Price follows the vector along as a direction finder! Note the top of the rebound leg finishes precisely at the purple reverse pendulum line after price has ‘balanced’ symmetrically either side of this line as it travels along it.
- New smaller red impulse down begins new retracement, primary red pendulum angle again catches the precise reversal at the next top.
- Price drops to solid green primary pendulum angle related to initial impulse vector for another precise reversal.
- Another purple ‘reverse pendulum’ setup catches the next top as a direction finder.
- A set of blue vectors catches the precise primary pendulum motion reversal at the next major top. This is the only ‘special case’ technique here to catch a swing end point slightly different to the standard approach. This type of pendulum motion is not normally used for trading set ups, but is included here for interest.
- A set of green primary pendulum angles catches the next low again to perfection!
- The next ‘reverse pendulum’ has caught one top already althoughj price action is still riding this vector for now. The top was also given by the red primary pendulum angle swing back from the retracement to the initial impulse vector (large lines red set). Note the near perfect revesal on this red angle in both price and time, in other words price reversed happened right at the very tip of the vector! This end pont was necessary to balance the forces of the red major angles, plus re-balance the price action either side of the purple direction finder vector.
- Next price has crawled along to find the vector again for what could likely now be the final top coming next of this vector move.
- For interest, there are two main lows now in play for the vectors to find the next inevitable pendulum swing down, these are the purple set low (7) and the next one (10) that just missed the purple ‘parallel’ that is used to get the reverse vector (and will also act as the next pendulum line of price indeed obeys that vector).
Further Market Setups (Not all chart techniques shown)
Here are a few different typical set ups and targets all from this method, the most important is a ‘Classic’ major context set up (late 2019) with Elliott 5 Wave impulse followed by a simple ABC correction (this is common Elliott). Pendulum motion is clear at the end of the major correction.
Set Ups
- Master Line Long from the 1x1 line – Exit at Target (method not shown)
- Cradle long at a neutralization point and pendulum angle – 2nd Exit
- ‘Classic’ Long from Angle of Pendulum Reaction (APR)
Note that the Gann boxes basically provide a diagonal tunnel, the entire tunnel runs 6.5 boxes up from low to high, makes a right angle turn, then 4 boxes down.
(Note: Top box is shared by the 4 down and 6.5 up. This is a ‘vector’ ratio of 4:6.5).
S32 Weekly with Typical Setups and Exits (not all techniques shown)

If you are someone who uses Elliott Wave principles, this example clearly demonstrates why you want these angles, matter of fact if you are in the market at all you why want this course! The geometry and angles of the green core angle set including the 1x1 master line (black) are the foundation for all the set ups. Scaling is achieved via a strict mathematical procedure. Confirmation, targets and extension techniques taught in depth include a stunning and brand-new application built from a single scaled vector that has both direction forecasting and channel width pre-set before price ever hits the channel! (not shown here, completely different technique)
Alexander Straker
January 2020
Traders World Articles
Related to The Universal Golden Keys Series
By Alexander Straker
Article 1 – Trader’s World Spring 2020
Using Pendulum Motion to Define Trend and Swing Limit
"The power to determine the trend of the market is due to my knowledge of the characteristics of each individual stock and a certain grouping of different stocks under their proper rates of vibration. Stocks are like electrons, atoms and molecules, which hold persistently to their own individuality in response to the fundamental law of vibration. Science teaches that 'an original impulse of any kind finally resolves itself into a periodic or rhythmical motion; also, just as the pendulum returns again in its swing, just as the moon returns in its orbit, just as the advancing year over brings the rose of spring, so do the properties of the elements periodically recur as the weight of the atoms rises."
– W. D. Gann
In his metaphoric, yet educational explanations Gann constantly hinted at deeper truths. What did Gann really mean by this intriguing quote? A number of important hints are given here regarding market methods and the pathways of study in science that underpin such methods with sound, and enlightening logic. The important hint we will focus on in this article is pendulum motion.
This CHFJPY chart example uses a single technique based on revealing the symmetry of pendulum motion. No less than 7 times in a row, ONE single angle technique (that is one line only!) produced a near touch perfect reversal pivot each and every time price touched the ‘angle of pendulum reaction’. (see chart next page: red circles). The fact that this same natural symmetry of pendulum motion continued to occur repeatedly defined this trend segment as a stable trend. Confidence in trend helps trader psychology.
CHFJPY
Every single one of the 7 consecutive impulse vectors this technique was applied to in the trend segment produced a clear, ideal low risk trade opportunity with plenty of reward for risk. In 1 of the 7 cases, price took another swing back at the angle of pendulum reaction (APR) line and this second reaction swing exceeded the normal limit of motion (see green angle set) then reverses precisely at the next harmonic angle of ‘overbalance’ (green dashed angle). This overbalance line is the second angle of importance in the core pendulum motion angle set and it rejects price, sending it back down into a stable trend again as defined by the next set of angles (purple) which show a normal pendulum limit reaction again.
The first principle of pendulum motion is: if the correction to an impulse vector ends within the limits of pendulum motion, the trend is stable in the vector direction. Plus ‘end of trend’ as defined by pendulum motion, is hinted at the first time the new reaction vector EXCEEDS our angle of ‘overbalance’ for any given angle set, this is when the existing trend is no longer considered stable and a hint it may be coming to an end. Pendulum angles not only precisely define outstanding low risk potential entry points (limit of motion), they also define the validity of the trend according to the symmetry of pendulum motion.
The core angle of pendulum reaction (APR) is calculated via a strictly defined mathematical technique, and natural symmetry is achieved via application of Pythagorean vector scaling principles. The CHFJPY chart example shown next was re-scaled for each set of angles. This re-scaling is not always necessary, many techniques do not require this. The point here was to show the incredible consistency of pendulum motion in precisely defining both the trend and precise limits of several consecutive swings when correctly applied.
CHFJPY
The core harmonic tools of this system (require scaling taught in the book) provide the trader with the capacity to project the natural symmetry of pendulum motion as pure circular angle values. This method uses ‘seed information’ directly from the original vector being measured, and a strictly mathematical calculation is used to firstly set a circle-based scale, then apply relevant angles of reaction to the original vector according to pendulum motion.
If you have been beating the Gann path a while, you already know the value of a true universal method, this is based on natural law of pendulum motion, and consistently and accurately uncovers the precise limits of market swings (further harmonic geometry is used in the full system).
As in the CHFJPY example above the core method begins with choosing a price action vector representing ‘action’ and plots a single main angle of ‘reaction’ to this vector, this is done multiple times in the example, those are the sets of coloured lines. A secondary line of ‘overbalance’ is also part of the main lines in the core tool set, this is the green dotted line in the above example as only one of these is plotted above as price action only ventured beyond the primary reaction line once in the whole sequence of this example. As price reversed at this reaction line, we begin another vector from there as the new action line, and plot a new reaction line, and so forth.
It is worth noting this core single technique applied above provided a near perfect pivot reversal at the ‘reaction’ line 7 times in a row, successfully locating an ideal low risk entry for each successive market move in the downtrend sequence. Not to say the author advocates relying on a single technique, this is of course incredibly valuable as a foundation to build set ups around. The reaction lines themselves represent natural angle of pendulum motion reaction vector swings according to each ‘action’ vector measured and are a true universal market phenomenon. Straker goes very deep into theory of why this works in his book, so much so readers are left with a rich sense of confidence in the basis for expecting precision and consistency, psychologically this makes a world of difference!
Pendulum Motion is a very natural and elegant harmonic solution to identify and capture the majority of ‘end of retracement’ reversal pivots during a stable trend segment. The core tool alone is an extremely powerful compliment to any system of swing trading or even long-term investing. Best of all it is an almost completely unknown form of genuine harmonic analysis, giving you a true ability to see what others cannot.
In a stable trend, the single main ‘reaction’ angle (APR) will continually give an accurate support & resistance level for the retracement to the original vector. If the swing reaction to the original vector chosen produces a deeper retracement than the single main APR line, then the secondary ‘overbalance’ line (ACS) will be the next major support/resistance (limit of pendulum motion) if the trend is to remain intact. In both cases we expect a precise reaction at the angle and one important aspect of the method is to look for a high degree of precision when price reacts to the pendulum angles, as that is what our expectation should be when correctly applying natural law harmonics of pendulum motion during a stable trend segment made up of impulse-correction/action-reaction sequences!
Those who have come to appreciate the recent work of Sean Erikson will immediately appreciate the significance of what is being presented here. To be clear this is absolutely not the same thing as Erikson’s brilliant work, and not an astro dependent chart application so you don’t have to have astro software to use the pendulum motion methods.
The principle at work behind this tool has many applications far beyond the core tool itself, the advanced geometry introduced my recently released Book 1 of The Universal Golden Keys Series: Pendulum Motion, Geometry of the Circle presents an expose of an incredible array of powerful geometric information available from a simple ‘seed’ vector (the initial impulse or Gnomic Event – GE). Any ‘seed vector’ can be viewed as a DNA pattern for growth, and after thoroughly explaining the core tool mathematics, the concept is extended with arcs and boxes introduced to project limits of natural growth phases as targets.
An original mathematical pattern discovery I have made is also explained in the book, and this elegantly defines the most common Elliott wave impulse-retracement fractal sequence known as a 5-wave impulse and 3 (or 5) wave retracement. Information from this pattern discovery becomes the basis for a full geometric ‘growth template’ that can be applied to any ‘seed vector’ and is founded on the core pendulum motion principle.
The beauty of the core pendulum angles tool in this method, is that specific vector information absolutely defines the scaling rule mathematically, and once the scale is set the normal limit of pendulum motion is accurately given by a single main ‘angle of pendulum reaction’ (APR), plus an ‘angle of critical support’ (ACS) is used to catch any overbalance.
These two angles will define the normal limits of pendulum motion of a retracement (correction) to any genuine impulse vector, with approximately 80% accuracy in any market and on any time frame.
These pure geometry techniques unveil a truly universal law of market symmetry! Precise and definitive, the natural and perfect symmetry of pendulum motion is seen at work again and again identifying precisely defined reversal pivots! (see chart examples). This level of precision is what we should expect when using authentic harmonic methods to locate genuine points of strong harmonic resonance in price and time!
Please note that the authentic key chart scales used for the core technique demonstrated here have been deliberately altered in the charts to preserve the method, however the angles are in the precisely the same position as they would be on the original scale so all lines are true to the original picture.
GOLD Daily chart with a bullish vector and a couple of related pendulum angles.
Note the first couple of reactions to these lines (both APR and ACS) are near perfect, and these angles can be drawn in place as soon as the vector is completed, and a retracement is underway. This technique works universally for any time-frame or market. The long term target projected by the ‘seed vector’ is successfully met in this case (see below).
Crude Oil Index
A simple example of a bullish vector and the most significantly related angle to the vector itself, the APR. Only one trading line, that’s the solid line below (Remember the scale has been deliberately changed to preserve the technique, lines remain in same position relative to price).
Another near touch perfect reaction to the main ‘angle of pendulum reaction’ line! This tool demonstrates again and again an uncanny ability for locating precise reversals and is a foundation technique for identifying low risk opportuities! In a stable trend (continual and steady Elliott 5 wave genuine impulse for example) this single line technique is ideal for identifying high probability, repeatedly accurate reversals to each retracement wave segment of the impulse set (not that it is wise to rely on a single technique of course).
FTSE Weekly with main angle related to original vector
As with all methods, not every example is perfect! This FTSE Weekly chart overshot the main angle a little, but never closed below it. Note the two candles either side that rested on the angle. As mentioned this main angle technique will work as support repeatedly during a trend. In fact, this is a technique that actually tells you if the trend remains stable!
Of course the system is not being shown in full here only the core angles. There is also a confirmation system taught that clarifies the precise harmonic points of resonance in price and time. The confirmation tools and principles here are exceptionally powerful in pinpointing low risk set ups. The full pentagonal growth template taught has many comfirmation tools built geometrically into the lines and arcs of the template. Pendulum Motion, Harmony of the Circle is published by Institute of Cosmological Economics.
Alexander Straker
January 2020
Trader’s World Article 2 – Summer 2020
Using ‘Reverse’ Pendulum Motion to Define Vector Slope
This second article in the pendulum motion series introduces a new and original concept that extends the use of pendulum motion symmetry in a brand-new direction never seen before to my knowledge.
Pendulum Motion, Harmony of the Circle (book 1 of a series) presents new breakthroughs in understanding and applying the symmetry of pendulum motion, with multiple tools, applications, and the universal scaling key developed from over 30 years of professional trading and fund management experience.
To give an idea of how simple, elegant and consistently accurate this core concept is, coming up is a chart with multiple examples marked up, there are so many it becomes a little messy and in fact, some other equally accurate possibiities had to be left off!
In every case without fail, we can observe price action reversals from the‘limit of pendulum motion’ angles are extremely accurate, and in most cases a large trend continuation leg follows afterwards. The angle technique applied to unveil pendulum motion is almost always is a two line set of which a single line is by far the most important as the primary angle: the natural angle of pendulum reaction (APR).
Did I mention yet this system is simple and well defined to the point of being idiot proof? That’s why I personally like it!
There are many new concepts presented in this book, and of these ‘Reverse’ pendulum motion is one of the more simple and powerful ones (shown in the coming example). This technique uses a theoretical base line to project an exact reactionary vector slope following successful rejection of a pendulum angle, best of all this results in a single line to plot the future vector’s slope, and like with the core tool there is no discretion, one single line is plotted!
The purple pairs of lines in the next chart example represent this reverse pendulum motion technique. A theoretical base line of thrust is applied first, and to be clear, the base line is not relevant as support or resistance, note in the chart that price never touches the shallower angle purple lines – they are only used to set the technique up. The angle produced as a reaction to the base line acts as a ‘line of thrust’ forecasting the exact slope the reactionary vector will travel along using a single line.
XJO multiple pendulum effects, continual touch perfect major reversals!
This XJO chart has been prepared set to a scale calculated to suit the pendulum motion techniques. However the actual scale was deliberately altered slightly to preserve integrity of the method. All lines remain true. EVERY MAJOR SWING on this chart was defined PRECISELY by the core pendulum motion technique. ‘Reverse’ pendulum motion is also shown above by the purple lines.
After the required scaling step is completed initially, the chart never needs rescaling for all of the following techniques and this is exactly how they appear in the chart above.
Pendulum motion is a real phemonenon in the market, Gann said it, Baumring said it, now in this new book the maths, method, scaling key, logic and further geometric templating are being clearly and thoroughly explained. This example is a little busy with lines but the point is to illustrate the sheer power and consistent symmetrical perfection of the law of pendulum motion! Sometimes you need to remind yourself these were pre-drawn lines before the price-time reactions at the arrows, just look at the crazy number of touch perfect pivot reversals and most of this is from ONE single line technique!!
IMPORTANT NOTE: THIS IS NOT THE ENTIRE SYSTEM, ONLY CORE ANGLES
- Initial Green Impulse Vector. The core technique angles, the two large green pendulum motion based angles are plotted next. These are the primary pendulum angle of balance and secondary angle of overbalance (Angle of Critical Support or ACS line). As you can see for yourself every major swing is unveiled in the sequence of elegant geometry to follow using only primarily a single balancing line technique, the key is to this the scaling method.
- Price drops to the secondary overbalance angle and reverses precsiely on the line. A purple vector parallel to the green overbalance line is added to the low of the retracement vector and this is then used for a ‘reverse pendulum’ set up back the other way, the steeper purple line that catches the next top to perfection! This time the vector acts differently due to this being a ‘reverse vector’ application. Price follows the vector along as a direction finder! Note the top of the rebound leg finishes precisely at the purple reverse pendulum line after price has ‘balanced’ symmetrically either side of this line as it travels along it.
- New smaller red impulse down begins new retracement, primary red pendulum angle again catches the precise reversal at the next top.
- Price drops to solid green primary pendulum angle related to initial impulse vector for another precise reversal.
- Another purple ‘reverse pendulum’ setup catches the next top as a direction finder.
- A set of blue vectors catches the precise primary pendulum motion reversal at the next major top. This is the only ‘special case’ technique here to catch a swing end point slightly different to the standard approach. This type of pendulum motion is not normally used for trading set ups, but is included here for interest.
- A set of green primary pendulum angles catches the next low again to perfection!
- The next ‘reverse pendulum’ has caught one top already althoughj price action is still riding this vector for now. The top was also given by the red primary pendulum angle swing back from the retracement to the initial impulse vector (large lines red set). Note the near perfect revesal on this red angle in both price and time, in other words price reversed happened right at the very tip of the vector! This end pont was necessary to balance the forces of the red major angles, plus re-balance the price action either side of the purple direction finder vector.
- Next price has crawled along to find the vector again for what could likely now be the final top coming next of this vector move.
- For interest, there are two main lows now in play for the vectors to find the next inevitable pendulum swing down, these are the purple set low (7) and the next one (10) that just missed the purple ‘parallel’ that is used to get the reverse vector (and will also act as the next pendulum line of price indeed obeys that vector).
Further Market Setups (Not all chart techniques shown)
Here are a few different typical set ups and targets all from this method, the most important is a ‘Classic’ major context set up (late 2019) with Elliott 5 Wave impulse followed by a simple ABC correction (this is common Elliott). Pendulum motion is clear at the end of the major correction.
Set Ups
- Master Line Long from the 1x1 line – Exit at Target (method not shown)
- Cradle long at a neutralization point and pendulum angle – 2nd Exit
- ‘Classic’ Long from Angle of Pendulum Reaction (APR)
Note that the Gann boxes basically provide a diagonal tunnel, the entire tunnel runs 6.5 boxes up from low to high, makes a right angle turn, then 4 boxes down.
(Note: Top box is shared by the 4 down and 6.5 up. This is a ‘vector’ ratio of 4:6.5).
S32 Weekly with Typical Setups and Exits (not all techniques shown)
If you are someone who uses Elliott Wave principles, this example clearly demonstrates why you want these angles, matter of fact if you are in the market at all you why want this course! The geometry and angles of the green core angle set including the 1x1 master line (black) are the foundation for all the set ups. Scaling is achieved via a strict mathematical procedure. Confirmation, targets and extension techniques taught in depth include a stunning and brand-new application built from a single scaled vector that has both direction forecasting and channel width pre-set before price ever hits the channel! (not shown here, completely different technique)
Alexander Straker
January 2020
The Market is Talking to You
“The Market is Talking to You” is a quote from the great Dawn Bolton, and for many years I had no idea how literally she meant what she said!
For a simple to apply example using pure numbers (no Astro), by using an appropriate scale in most cases the angle of incidence of any market vector is directly related to numerical price at the start of that vector. In most cases simply applying a line at the angle of a direct price harmonic (sometimes moving the decimal place) gives you the angle of incidence of the Vector or Gnomon.
Of course, this is somewhat dependent on scaling skills, applying the principle of Golden Speed scales (see “Universal Golden Keys” book series) will ensure this principle works. In fact, it as a matter of harmonics, it must work for Gann’s methods to be valid. Natural law says so, and this statement becomes clearer as market experience is gained.
A lesser number of times, the angle of incidence will be a typical simple harmonic multiple or division value of price such as precisely half or double the price.
With minimal practise, your eye will tell you very quickly whether to use the exact price or an adjusted harmonic value simply by observing the angle of the Gnomon developing, providing your scale is set correctly, around 75% of the time the exact Price works as an accurate angle of incidence or angle of return (either 2 digit angle or 1 digit angle can be applied, or both).
To be clear, the first market advantage this is presenting is a directional vector that will define the thrust line of the Gnomon following the pivot chosen. The second is an opposing or ‘mirrored’ symmetrical limit-of-rotation angle around the pivot roto-center, more about that soon…
Note, the first advantage of the predictive vector is not the same thing as a support or resistance line, in fact it is more akin to a median line of thrust. Price action will be ‘pulled along’ this angle, and the impulse vector will end on, or very near the angle. I refer to this as a limit-of-rotation, even though price may just venture either side of the angle at times.
The line of force is what is important, as this is defining the true limit of any counter-rotational forces. The vector impulse is a linear, directional wave-form energy that will stop and redirect any rotational force hitting the vector line. The very tip of the vector also defines an important boundary of force in Time and Price.
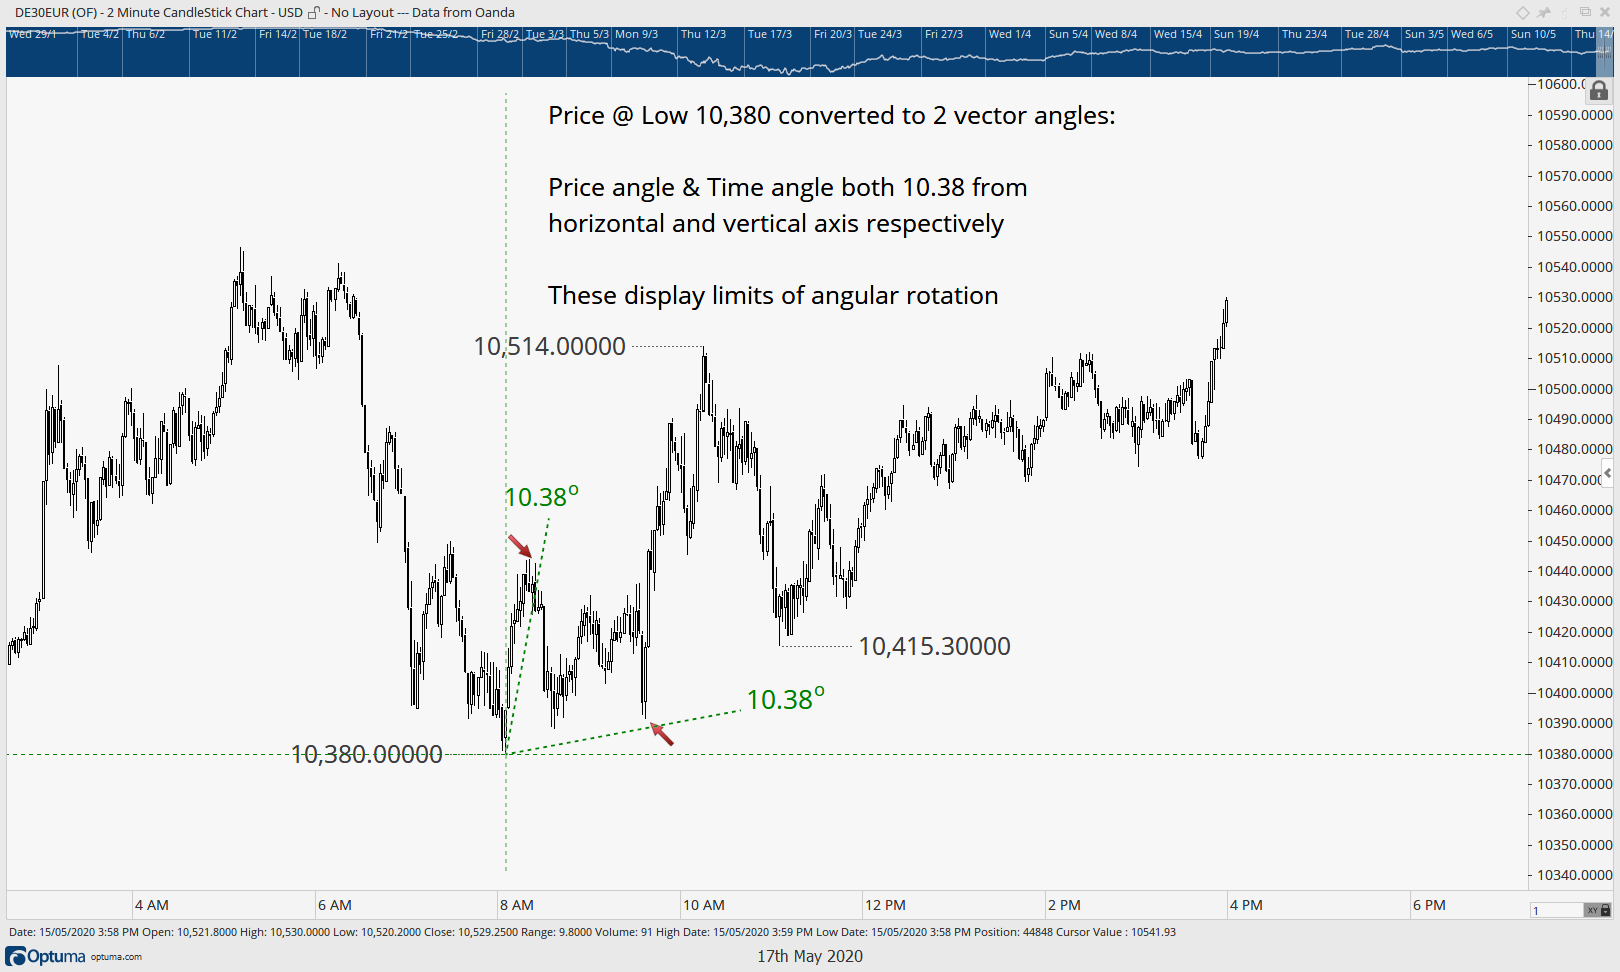
In this SPX example, the only time price goes a touch beyond the vector’s line of force (exact Price-Angle!), is the first impulse candle down, the remainder of the vector is basically crawling along inside the limit of rotation.

Angle of incidence can occur from any horizontal or vertical axis, so there are a couple of possibilities depending on trend direction and whether the angle turns out to be the horizontal or vertically measured angle.

As time moves forward, these are the four possible angles of incidence, all angles occur at an identical 25-degrees relative to a horizontal or vertical axis.
This SPX 2-Minute chart shows the two most important angles derived directly from price, and the clear Limits of Motion this technique provides.
For this example, the Price-Angle is an exact harmonic of price and occurs relative to the vertical downside axis. In a moment you will see how this principle can be extended for discovering additional valuable harmonics.
Providing you locate the key angle correctly, precision in Price reactions can be expected. The best part about this tool is how quickly and easily it can be applied.

Price action is sometimes off by a tiny fraction, as with all geometric techniques, but for intra-day use, the market reactions to Price-Angle geometry are quite astounding and very useful to have in the toolkit! Much more so when we learn the Astro implications.
The symmetry of pendulum motion is extremely clear and well defined by the price-derived angles. With some scaling practise and added techniques for confluence & confirmation, this is a very neat and easy to apply universal market edge.
The only discretion sometimes needed is a harmonic adjustment to the price-angle numerical value such as floating the decimal, or doubling, or halving, etc. It is often easy to see by eye what is working for the current vector by knowing the angle price gives you a quick estimate of whether an adjustment to the number can be made. It may surprise you how many times the exact price number works!
Naturally, this is scale dependent. The basic rule is to start by trying “price equals time (scale = 1)” or floating the decimal (0.1, 0.01, 10, 100, etc.). For more information on how to scale, see Book 2 of the Universal Golden Keys Series.
With the bifurcation (half-angles) added, we observe the next harmonic reaction, again all this is derived from price at the pivot, remarkably simple!

How about the next bifurcation?
Once again, another precise reaction!

The Price-angle is amazingly effective for defining limits of angular momentum and delivers beautifully elegant ‘no brainer’ foundation geometry in seconds.
Imagine having a trading genius sitting right next to you, whispering in your ear what the market is going to do next. Well…guess what? That trading genius is the market itself talking to you!
Now how many occurrences of these kind of ‘co-incidences’ can you expect to find?
Well…it is all a matter of listening carefully and we could benefit from listening again and reminding ourselves of that phrase the great Australian TA and Gann master Dawn Bolton says… “The market is talking to you!”
For more information on these techniques, see my trading course, Pendulum Motion.
Alexander Straker
September 2022
Related Pages
About Alexander Straker
- Alexander Straker - Author Intro
- Alexander Straker - Trading Records
- Alexander Straker - 12,000% Account Record
- Alexander Straker - 2022 Trading Forecasts and Results
- Alexander Straker - Customer Feedback
- Alexander Straker - Frequently Asked Questions
- Alexander Straker - Edson Beer (Gould) Articles
- Alexander Straker - Traders World Book Review
Straker Courses
Straker Forums


