


The Long Term Investing Study Guide Learn How to Trade The Long Cycles
Who is it for?
- Self managed investors looking for forecasts services to provide them with big-picture trading signals
- Baby Boomers and retirees who would like to learn how to manage and grow their capital.
- Professional money managers seeking tools or services to help gauge the long term investment climate and general market trends.
Introduction
While longer term investors are generally not as engaged in complex financial research as traders tend to be, they still require some guidance as to what to expect in terms of the longer term cycles and trends of the market.
Following are our works which more specifically focus on a longer term, bigger picture perspective, creating cyclical models and trend indications for the long term market structure. We also have some informational resources that focus on the longer term perspective of the investor.
Books & Courses on Long Term Investing & Forecasting
Long Term Investment Books
- Nikolai Kondratieff – The Long Waves in Economic Life
- Henry Hall – How Money is Made in Security Investment
- James P. Morton – When to Sell to Assure Profits
Long Term Forecasting Courses & Reports
- Daniel T. Ferrera – Wheels Within Wheels: The Art of Forecasting Financial Market Cycles
- Daniel T. Ferrera – Economic Stock Market Forecasting: W. D. Gann’s Science of Cyclical Periodicity Sequencing
- Gordon Roberts – Market Vibrations: W. D. Gann’s How To Make Profits in Modern Markets
- Daniel T. Ferrera – General Yearly Outlooks For The Stock Market
- L. David Linsky – The Key to Speculation in The Gold Market
Sean Erikson's Trading with Selene's Chariot - Long Term Applications
Selene's Chariot stands out as our most popular trading course, containing a set of tools that are theoretically profound in their implications while being so simple and practical that a teenager could use them. The first of these tools projects the exact slope of the forthcoming trend from the point of the last high or low, in advance! Using a tool based upon celestial mechanics, it is able to determine, within bars of the new trend, the exact slope angle of any and every trend in any and every market. This is one of the most simple and mind-blowing principles we have ever seen. It also demonstrates, without question, that celestial mechanics control market trends.
The Toolkit, much like an Andrews ML Line & Pitchfork, creates a channel which contains the full breadth of market movement during that swing. It provides two projected termination points for the move, the 1st of which stops the move 75% of the time, and the 2nd which catches most the rest. It also projects the likely time turning point for the next 2-3 turns. Trading with Selene's Chariot provides, hands down, the most useful set of trading tools for intraday to long term Swing Trading that we have seen.
But what many Selene's clients do not realize is that Selene's is also one of the most effective long-term trading management programs there is. Many assume these tools only relate to shorter-term trading, so we asked the author to provide us with a couple examples of the long-term applications of this important work.
Following we have posted a chart of the long-term swings in Bitcoin covering it's spectacular run up to $70,000 followed by its cataclysmic collapse back down to $15,000 in a matter barely a year in each direction. We witnessed many people who were fortunate to have ridden the wave up, but then had no further game plan and rode it all the way back down. Just a simple plan like is presented in Selene's Chariot would have saved such investors a fortune to last a lifetime if they had only had some simple rules like we have here.
After the Bitcoin example, we have provided a second example on the S&P500 showing how Selene's tools beautifully navigated the insane market volatility from 2020 through 2023. These tools would have had one out of the long bull market up to 2020 and short into the March low, then would have signaled a long position with the initial up move and would have stayed in until just after the 2022 top, where they wold have been short again. Or if as a long term investor, one did not trade short, one would at least have been out of one's positions so as to preserve one's capital for the next upward move. These historical swings which confused the best of professional traders and managers were easily handled by these Selene's tools on a practically automated basis.
Example: Selene's Tools Perfectly Traded the Rise & Fall of Bitcoin!
Since the incredible interest in Bitcoin these last years, and the spectacular rise and fall of this market, many have asked how the Selene's tools performed on the Bitcoin (Futures shown here) market. So, Sean created a longer term Bitcoin chart with Selene's Channels and provided a step by step guide as to how one would have easily traded these huge Bitcoin swings with very little trouble, generating superb profits doing so. The following analysis only uses the simplest approach to applying Selene's tools, staying on only one time level and using the break in the channels as the trade indicators.
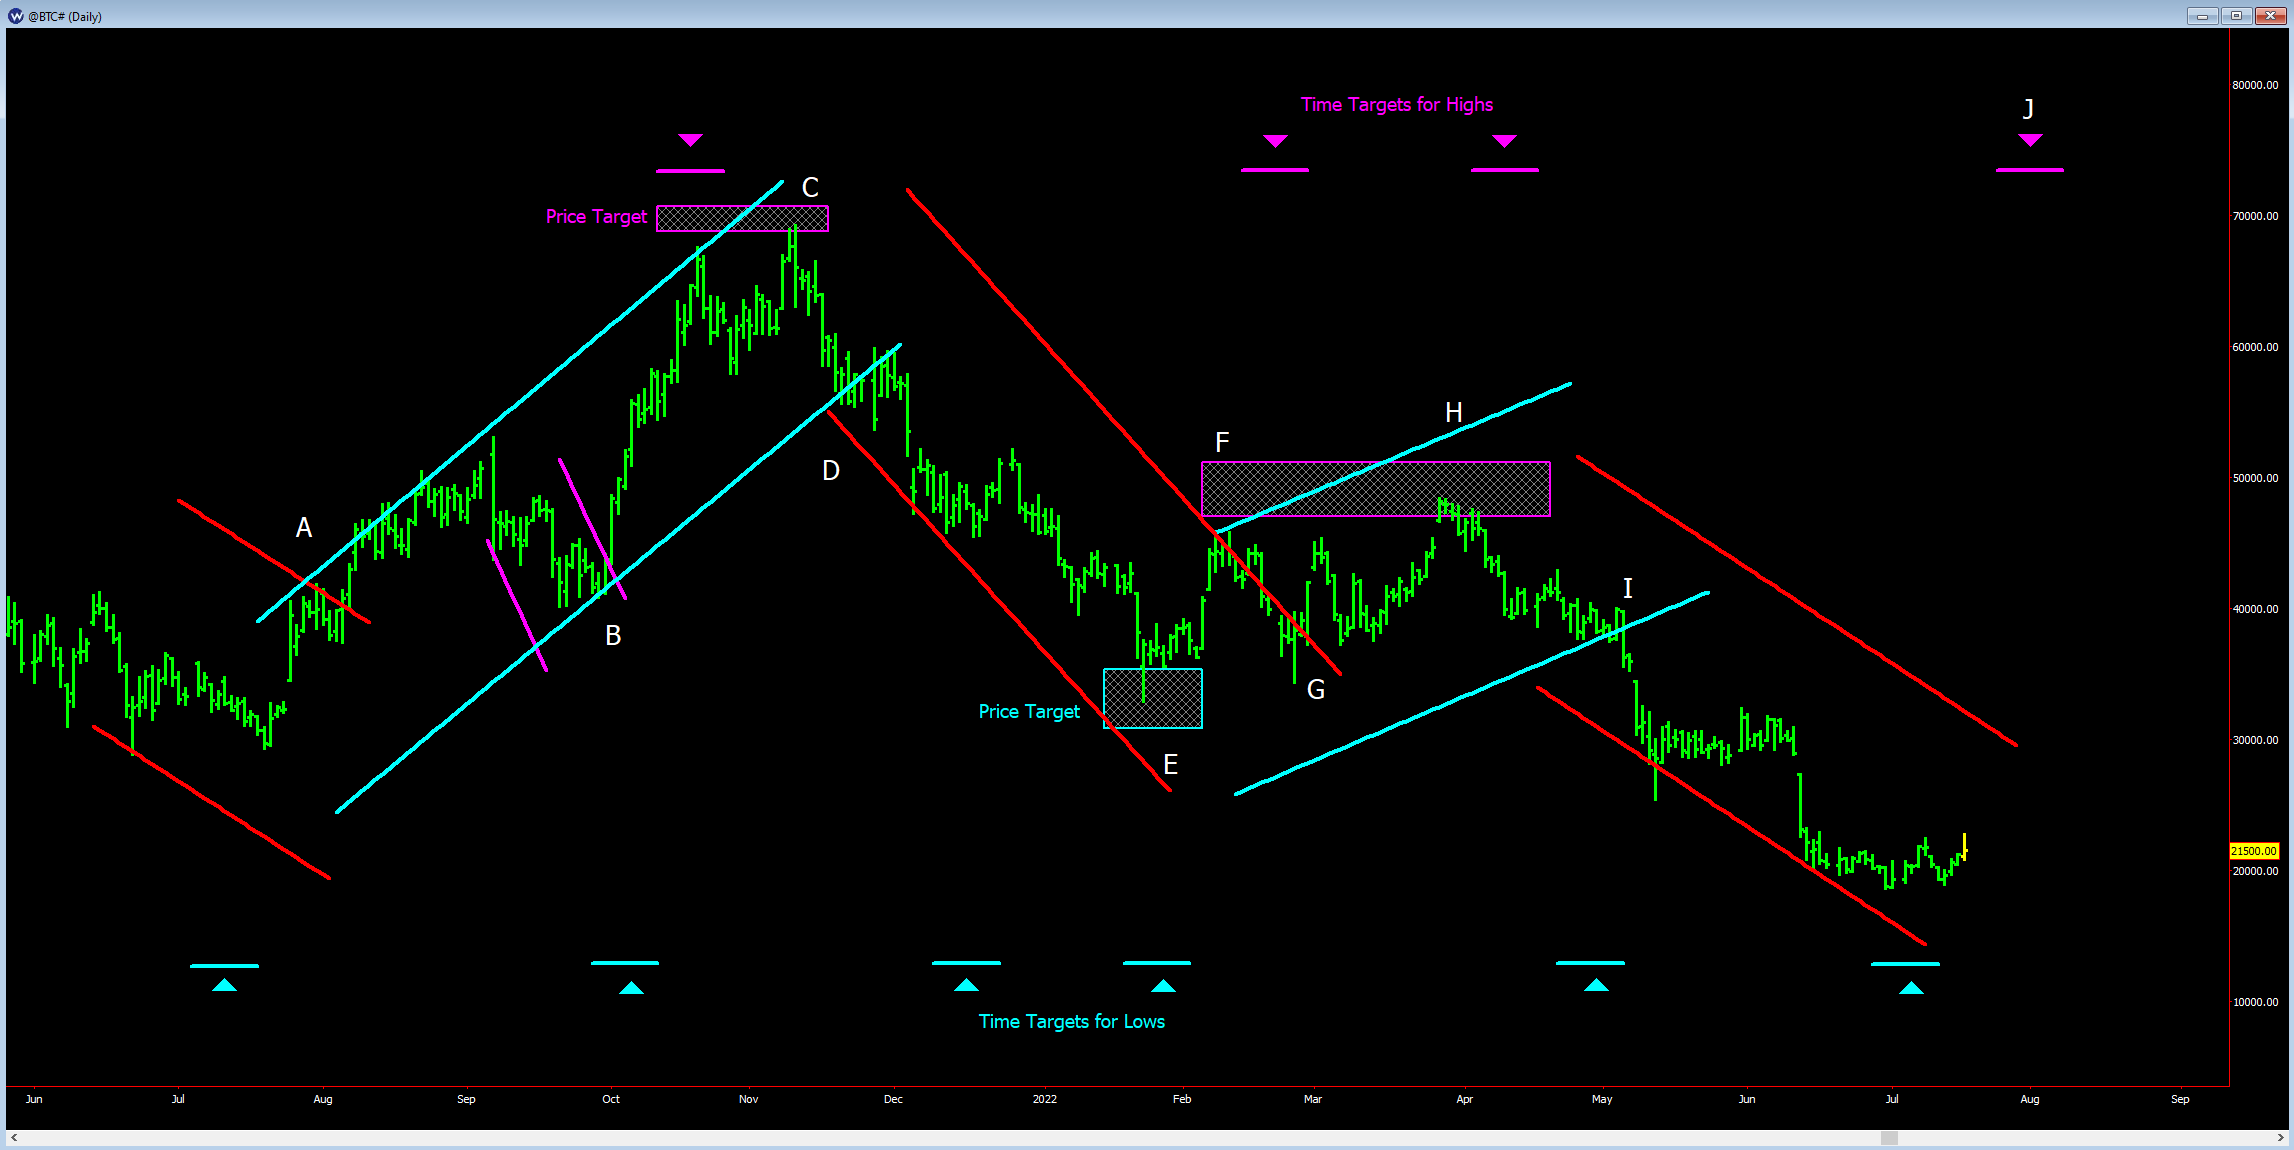
The channels are shown in red and blue. Red channels are down-trends, blue-channels are up-trends. The channels are our main tool, and are supplemented by price targets, as well as time targets. Price targets at various swings are shown as reactangles and the arrows at the very bottom of the chart and top of the chart are time targets. These three things, along with price action, are all you need in order to trade this market. No squiggly lines, no forecasts, no calculations, etc. Just go with the flow...
I have labeled the key areas and provide a description following:
A: Bitcoin has been moving downward in this channel, and is bumping up against the top. As it breaks, we would have a buy signal here. However, the blue channel, which is the upward-channel that price will be following after the break, shows that price is at the very top of the channel, which made it a slightly riskier trade. In general, we'd have waited for a pullback within the channel. This pullback happened in Sept 2021, shown by the fuchsia channel down into point B.
B: The pullback takes us to the bottom of the blue channel. This allows us to get long with a very manageable risk (underneath the channel). Note that we've got a time target for a low here (blue arrow at bottom).
C: We'd have lightened our position as we hit the top of our channel, and bumped up against our price target. Note that this price target was solved all the way back at the low, before point A. A time target is sitting here as well. We don't go against the trend though, so we do not short yet, but definitely take our profits.
D: Breaking the upward-moving channel is the signal that it is time to go short.
E: This is the reverse of the previous high. Hitting a price target at the same time a time target comes in tells us it is profit taking time.
F: The market is not quite able to break through the top of the channel, and slides down into point G. Note that F happened at a price target, which suggests there's not a ton of upside. A time target kicks us down into G.
G: Channel breaks. The trend is up. We go long.
H: We hit our price projection again and have a time signal so Time/Price kick us down again.
I: The downside of the channel is broken. Trend is down. Go short!
J: This is a time target in the future, giving us an idea of a setup for the future. If BTC rallies into this time, up against the upper red line, but then can't break it, that will be the time to add to the short. We should have taken profits on a big portion of our trade already, having been bumping against the lower channel lines and moving through two low time targets.
Example: Trading the SPY Long Term Swings
Some people have commented that the Selene's tools seem to apply more for short-term or intraday trading rather than long term trading. This is not at all the case, so Sean created a long-term S&P chart to demonstrate how the Selene's tools would have traded the market from teh 2020 crash, through the following bull market, and then into the transition into the new downtrend begun in 2022. The following chart and comments below show how a professional manager or long-term trader would have managed these massive moves using the Selene's tool:
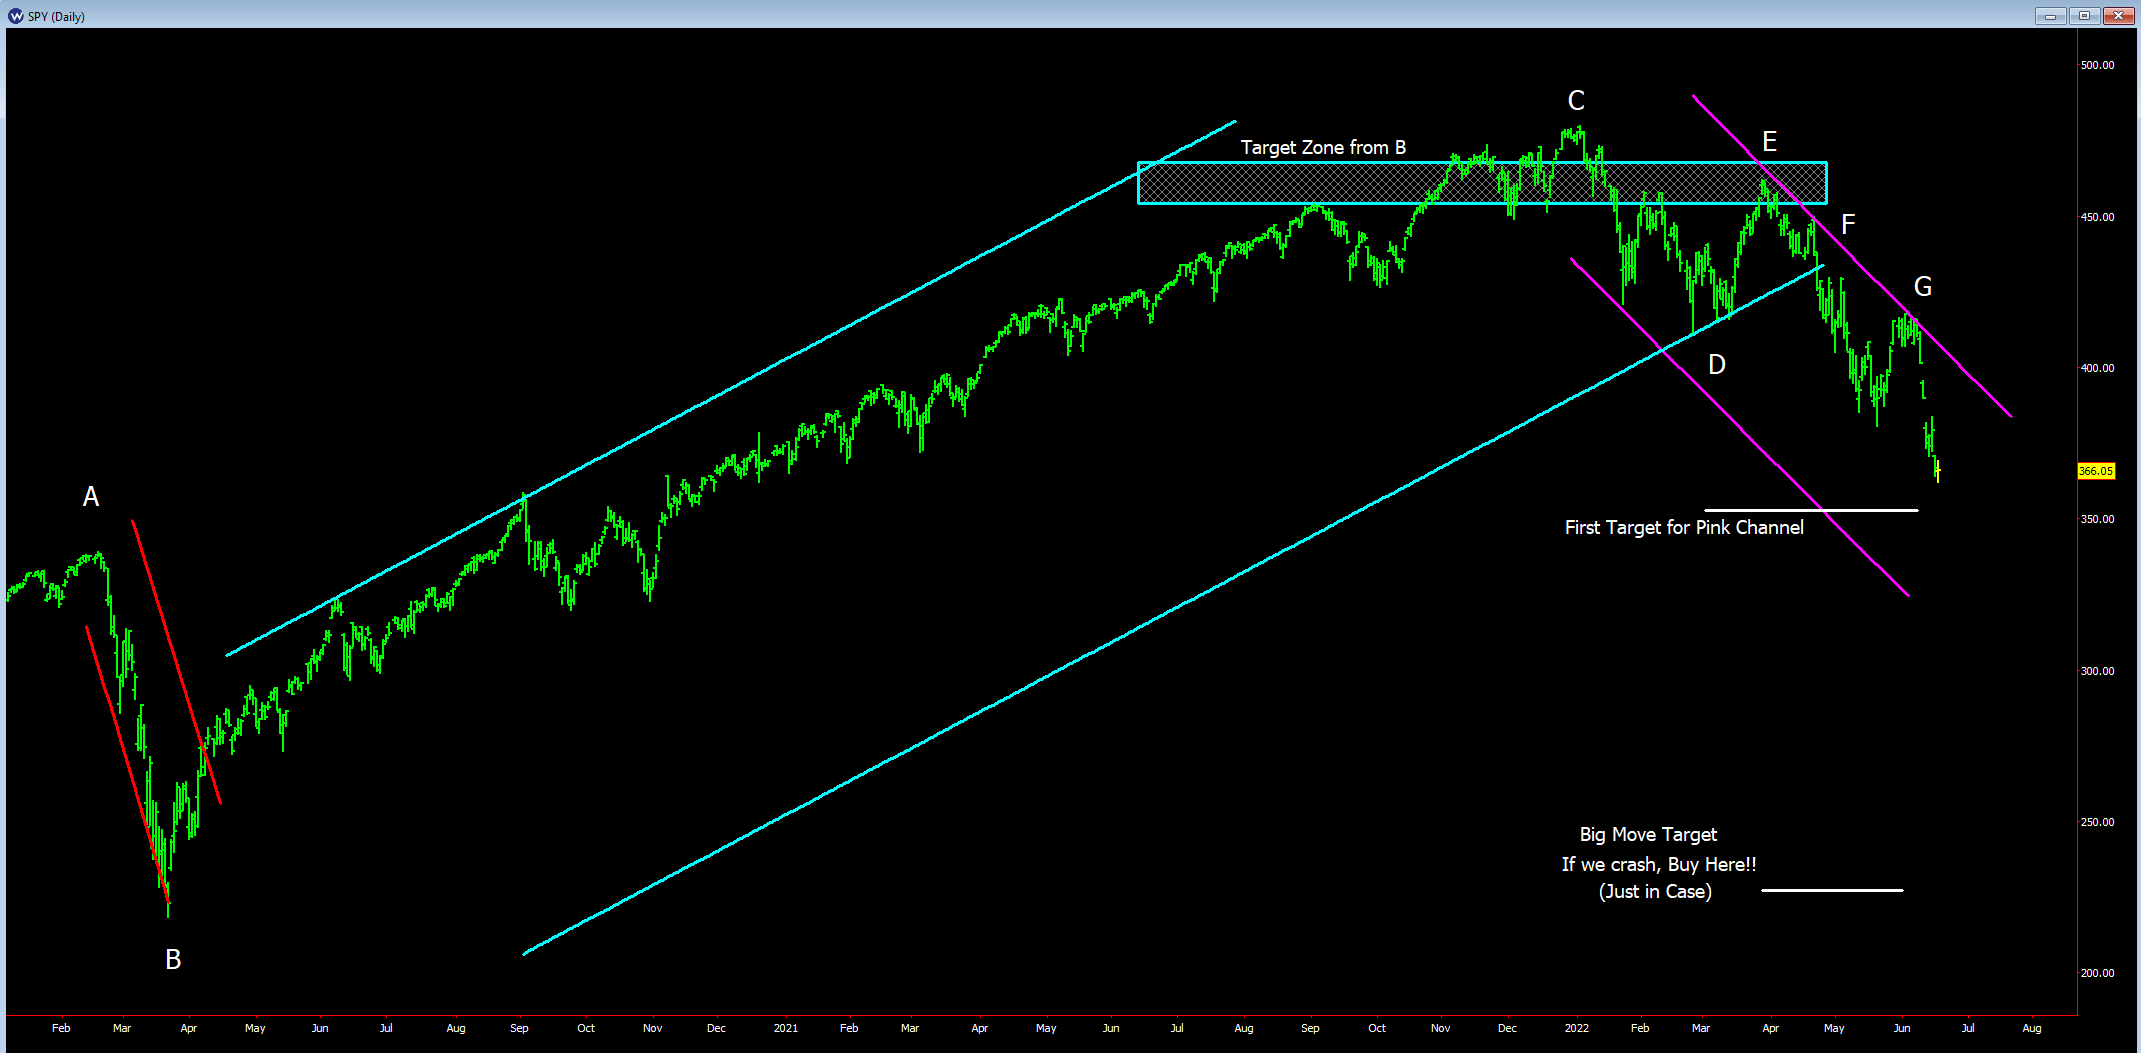
As usual, I've marked interesting points on the chart:
A: This was the 2020 Covid crash. The red channel was known as soon as point A was in.
B: When we moved out of this channel, this gave us a Buy signal as we moved into the HUGE light blue channel. Note that we had a price target for this (Target Zone from B), which I've drawn. We're either long the whole time, or we zoom into smaller channels and get long/flat all the way up (but never short!).
C: This is the big top in early 2022. The market is forming a head-and-shoulders pattern here, right on top of our target zone. We've got the pink channel set up here even before we break out of our wide blue channel.
D: We drop into the low part of our blue channel for the first time since point B. If we can't break here, we're long up to the upper edge of the pink channel, which is exactly how it worked.
E: This is the right shoulder of the head-and-shoulders. It's in our target zone, and the pink channel is coming down on top of it. Easy sell!
F: Sell more on the break of the blue line.
G: Sell more when the market finds resistance on the pink channel line!!!
The first target down from point C is shown by the 1st white line. Stops would already have been moved to break-even, with a profit taken there for a chunk of the position.
A bigger target is also shown further down below. If we crash (no guarantee, we always just go with the flow...), and if we get to that lower white line, we are buying. That's a once-in-a-lifetime buy zone if it happens! There is a lot of space on the chart to get there, but it's nice to know exactly what to do and where just in case. :-)
Next Study Guide
Related Pages
Introduction
The Scientific Foundations of Cosmological Economics
The Origins & History of Cosmological Economics
Cosmological Economics & The Law of Vibration
- An Introduction to The Law of Vibration
- William D. Gann & The Law of Vibration
- Dr. Jerome Baumrings Gann Harmony
- How Jerome Baumring Cracked W. D. Ganns Hidden Teachings
- How Baumring Proved His Mastery of Gann in Profits
- The Teachings of Jerome Baumring Through the Investment Centre Seminars
- Jerome Baumrings Circular Teaching Method
- The Death of Dr. Baumring & Birth of The Sacred Science Institute
- The Creation of Two Institutes
Forecasting Proof
- Forecasting Proof - CosmoEconomics in Theory & Practice
- The Commodity Forecasts of Samuel Benner
- The Market & Political Forecasts of W. D. Gann
- The Economic Forecasts of Roger Babson
- The Market Forecasts of Dr. Alan Andrews
- The Market Forecasts of George Marechal
- The Market Forecasts of Edward R. Dewey
- The Market Forecasts of Muriel & Louis Hasbrouck
- The Market Forecasts of Daniel T. Ferrera
- The Market Forecasts of Daniele Prandelli
How to Learn Cosmological Economics
- ICE Study Guides - Index & Overview
- Study Guide - Cracking the Code of the Markets
- Study Guide - Gann Theory
- Study Guide - Technical Analysis
- Study Guide - Financial Astrology
- Study Guide - CosmoEconomics as An Alternative to College
- Study Guide - Trading Mastery
- Study Guide - Position Trading
- Study Guide - Swing Trading
- Study Guide - Day Trading
- Study Guide - Long Term Investing
- Study Guide - Risk Management


